Canon Lenses Tests Results with a 21 Megapixel Canon EOS 5D Mark II
and EOS M and a few other cameras / lenses
![]()
Canon Lenses Tests Results with a 21 Megapixel Canon EOS 5D Mark II
and EOS M and a few other cameras / lenses
![]()
There are several sites on the Internet that describe quality of camera lenses. Some sites are technical and give detailed information about resolution and chromatic aberrations and some others describe "general feel" and experience of the owners, often subjective or misguiding, but still useful. Some people criticize both approaches altogether by claiming that no lens quality but photographers knowledge on how to make good pictures is virtually a sole factor of success in making great photos. Their reasoning is that the optics quality of all the lenses on the market is sufficient enough to make good quality photos that you can proudly store in an album. While one has to agree that a 2 megapixel, technically well done photo is sufficient for a 4x6" great print, and even under 1 megapixel picture is more than enough to present it over the internet as an "awesome shot", the lens quality is a very important factor for large format prints or when significant cropping has to be done, which is a relatively frequent condition.
I created this page not to compete with or duplicate information of already excellent sites availavle on the Internet (see the top links at the bottom of this page), but to add new information by presenting a novel method of measuring lens performance. So, please check the other sites first, that better describe general features of the lenses, usually in simple terms and show various charts, such as barrel-type distortions, vignetting, chromatic aberration and MTF50 (modulation transfer function; a "50" refers to 50% luminance difference between black and white lines) resolution graphs expressed in line widths per picture height (LW/PH). These values cannot be unilaterally compared because they depend on a camera type and its resolution. Besides the camera factor, the MTF50 data depend not only on lens sharpness but on picture contrast as well. That's why I introduce here another method of measuring lens performance.
In the past, I have tested several Canon lenses with a 17 M pixel full frame Canon 1Ds Mark II and noticed that several of them likely exceeded resolution of the camera's sensor. Therefore, with the arrival of a 21 M pixel full frame Canon EOS 5D Mark II I decided to improve quality of my early tests. Here I present the actual pictures of circular lines charts in a 100% magnification. The AF microadjustment (C.fn. II-8) was checked, but it only marginally improved the results in one case. All tests were performed with the image stabilization turned off, if present, outdoor, with camera mounted on a tripod in a sunny windless day. I chose the circular lines charts because, depending on a direction how the line is drawn, its sharpness may vary. The MTF analysis fails to address this. The results are simple to interpret in terms of how many vertical lines you can really see with the camera's theoretical limit of 3744 lines (or 37 x100 LW/PH). The test also clearly visualize other common, but more complex than "barrell/pincussion" distortions and color/contrast problems.
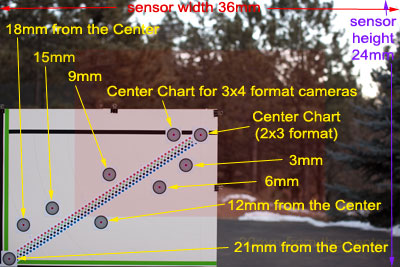
Explanation of the chart. A pattern of small (approximately 2" in diameter) multiple circular charts drawn on a 40x32" board within a 24x36" rectangle is photographed as shown on Fig. 1.
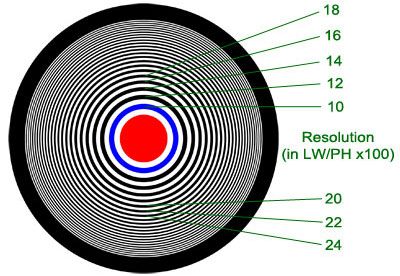
When photographed with a full frame camera sensor, the circle images are spaced every 3mm from each other, as indicated above. The single chart on this poster is shown on Fig. 2. In the middle of the chart there is a large red dot to test the evenness of a single color (red is usually most grainy, so it's the hardest to reproduce) and degree of sharpening (best if no sharpening is done so that the red circles color should be uniform). The first (blue) circular line thickness is 1/1000 of the picture height (1.22mm). The other lines are progressively thinner, so each consecutive black line counting from the center is of a thickness of 1/1200, 1/1400, 1/1600, and so on, of the picture height. The thinnest line that you can see on a photograph is the lens/camera resolution limit. The thick black circle outside the chart is drawn to analyze/visualize chromatic aberration. The white background near the circle is used to show vignetting (decrease of brightness at the photo extreme sides). The corner of most DSLRs (with APS-C sensor) is at about 12th mm from the center, see the reddish shaded area on Fig. 1.
Click on the llinks below to open available lens test results.
IMPORTANT NOTE. Lens resolution cannot be accurately described as a single number because the lines are not uniform in each direction. Moreover, the circles may have odd shapes and may appear larger on the corners than in the center or vice versa. You will also notice a variable contrast, depending on the lens and f-stop used. It should be noted that if a picture was overexposed, the resolution read lower (no matter how you adjusted the brightness/contrast afterwards). Therefore, the resolution number shown under each chart represents an average value rather than an absolute number, and sometimes this value is expressed in two (extreme) numbers. The photos also reveal additional ring patterns, that are not real and are due to the Moire effect. The sharper the image the more it is pronounced. This artifact is an indication that the lens resolution is approaching or even surpassing camera pixel density. I noticed that Canon firmware saves photos in JPG format less sharp than in the RAW format. See the page that compares RAW versus JPG picture quality. To see less distorted images, and the lines corresponding to over 3000 LW/PH I had to shoot only in RAW format. For this presentation, only the brightness was adjusted in the RAW files to make the background standarized for all the tests. All other settings, such as contrast or sharpening, were left default. Interestingly, a method of printing the charts also affects the tests. The best quality photos of the circular charts I was able to obtain on Kodak Endura Matte paper from AdoramaPix. Glossy pictures were of a similar quality but there was a higher chance of a glare, so they were not used.
This site gives only a limited number of lens analyses. Here is a list of web sites that may be useful for further studies:
SLR Gear - Basic charts (blur, chromatic aberration, vignetting, barrel type distortions), specifications, descriptions and consumer reviews. Very well done, broad lens selection.
Photozone - A broad selection of lenses very well described, backed up with scientific charts.
Digital Photography Review - Only a few lenses presented. If you find your lens there, it is very well described. This is an excellent site listing broad selection of camera reviews.
The-Digital-Picture - Good lens comparison and descriptions; no resolution data but ISO 12233 chart crops available but not explained; good vignetting data.
PopPhoto - Short but solid summaries. Finding a given lens is a frustrating task. No charts, but prediction of quality vs. print size is given 'for the dummies'.
Fred Miranda - Mostly casual opinions of a large number of users.
Imaging Resource - Site with camera reviews and good relevant links.
Tips on choosing a snap-shot camera - These are general guidelines on what is important when buying a simple camera.
SEIKI 4K 50" TV (SE50UY04), short review.

© 2012-13 PikesPeakPhoto. All rights reserved.